
G2 Network Statistics
2026/07/27 19:18:06 +00:00G2 density
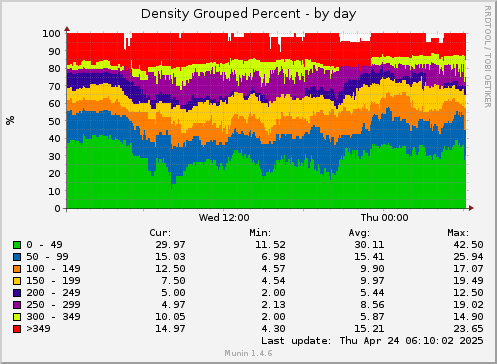
Day
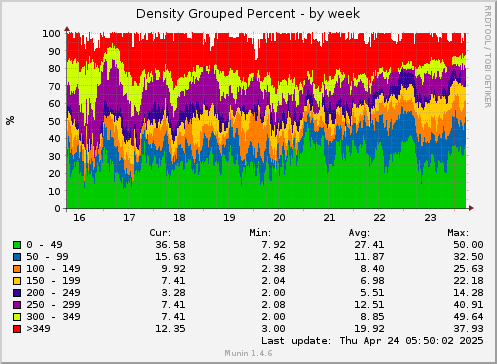
Week
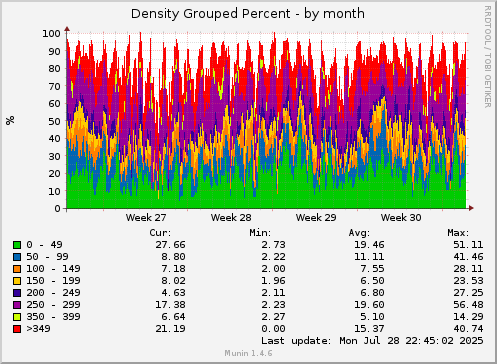
Month
Year
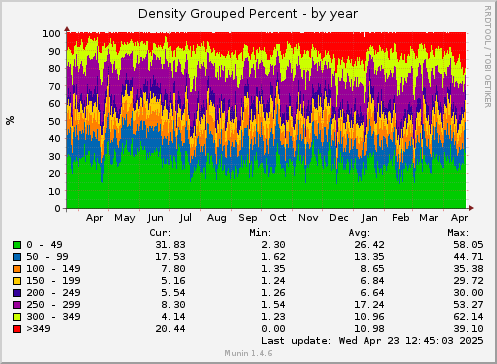
This page shows how many leaves each hub is connected to. It is grouped into 50 leaf increments. So for example the "0 - 49" row indicates that X number of hubs have between 0 and 49 leaves connected to each of them.
Hubs with more than 349 leaves are grouped together in the graph. The individual groupings are still shown in the Current Data table below.
The major graph change on 2011-07-03 was caused by a bug fix. I discovered that the graph has always been calculated incorrectly and was including hubs that hadn't yet been verified to be online so that slanted the numbers toward zero. In the week leading up to the major change the density can be seen steadily decreasing and that is what brought my attention to the problem. What is causing a larger number of unresponsive hubs to show up on the network? I do not know yet.
Current Data
| Leaves | Count |
| 0 - 49 | 9 |
| 50 - 99 | 4 |
| 150 - 199 | 1 |
| 200 - 249 | 1 |
| 250 - 299 | 5 |
| 300 - 349 | 8 |
| 400 - 449 | 1 |
| 450 - 499 | 2 |
| 1000 - 1049 | 1 |
| Uptime (hours) | Average Leaf Count | Hub Count |
| 0 - 3 | 57.82 | 11 |
g2paranha - 2026/07/27 19:18:06 +00:00 - 10 ms - Credits
 This work is licensed under a
Creative Commons Attribution-Noncommercial-Share Alike 3.0
United States License
.
This work is licensed under a
Creative Commons Attribution-Noncommercial-Share Alike 3.0
United States License
.