
G2 Network Statistics
2026/06/13 10:48:43 +00:00Uptime graphs
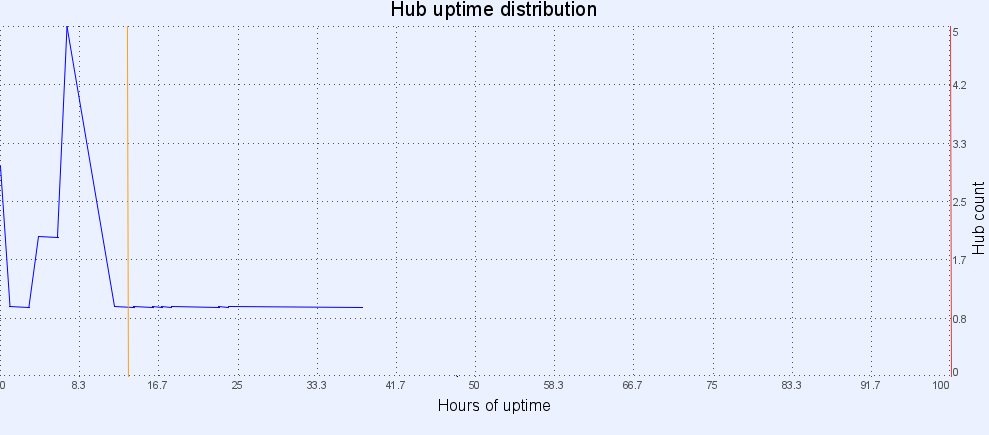
All Hubs
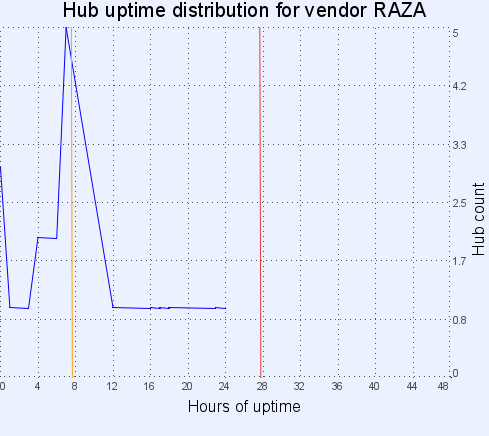
By Vendor
By Number of Leaves
By Country
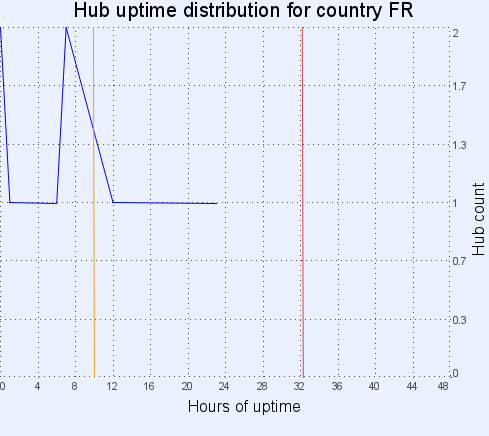
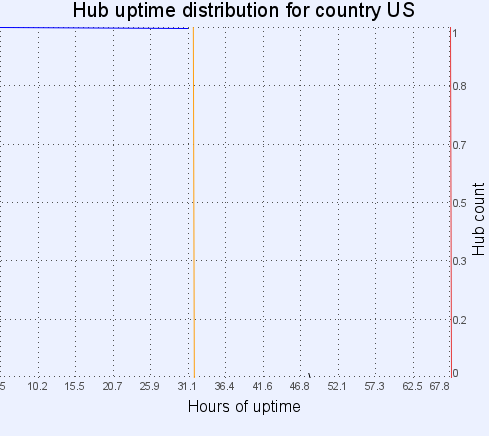
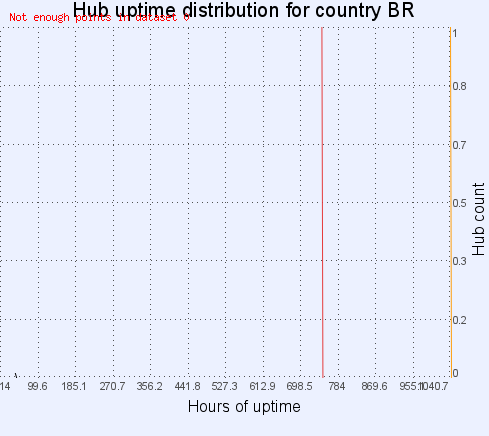
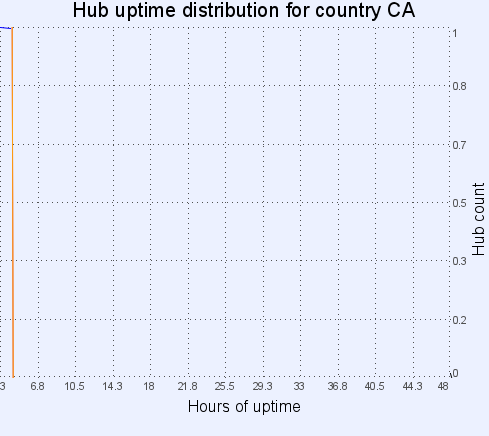
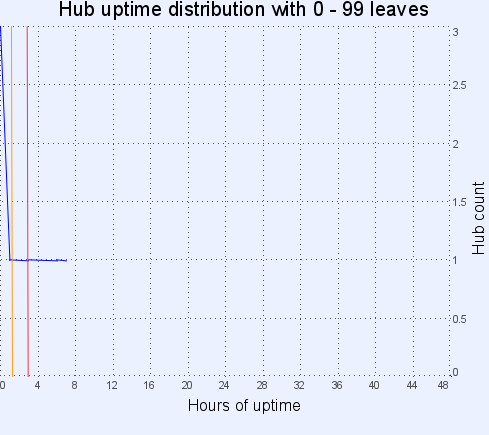
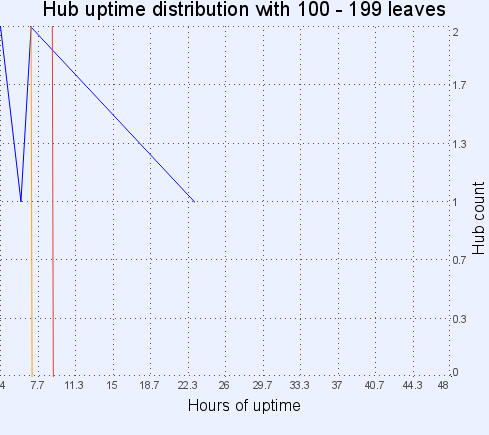
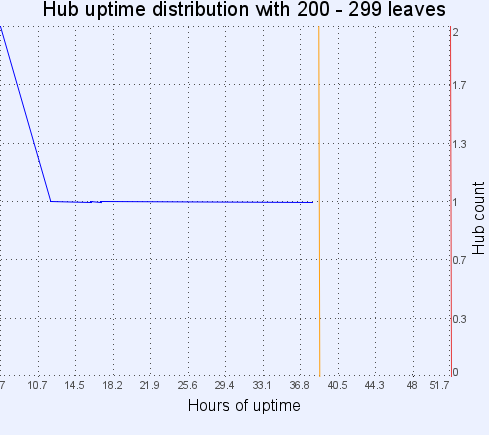
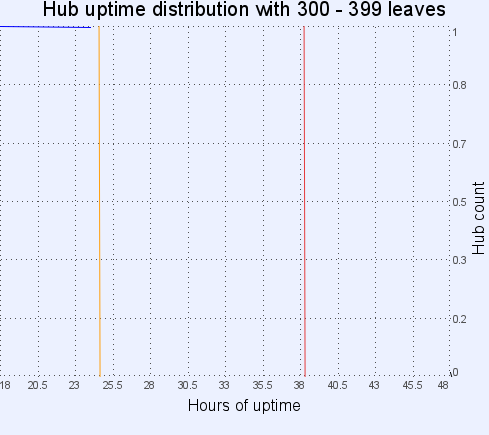
- The hours of uptime for all graphs has been limited to 2 days (48 hours) so that details on the graphs can be seen. Beyond 2 days the number of hubs is insignificantly small for the purposes of these graphs.
- The red line marks the average uptime. This calculation includes the hubs that have uptimes greater than 2 days.
- The orange line marks the median uptime. This calculation includes the hubs that have uptimes greater than 2 days.
g2paranha - 2026/06/13 10:48:43 +00:00 - 388 ms - Credits
 This work is licensed under a
Creative Commons Attribution-Noncommercial-Share Alike 3.0
United States License
.
This work is licensed under a
Creative Commons Attribution-Noncommercial-Share Alike 3.0
United States License
.